Operation metrics in GraphOS
Understand your supergraph's performance
If you have a cloud supergraph, its router automatically reports metrics for the operations that clients run on it.
For other types of graphs, see Sending operation metrics to GraphOS.
In addition, you can configure your subgraphs to include resolver-level traces in their responses to your router, which are then also reported to GraphOS.
Viewing metrics
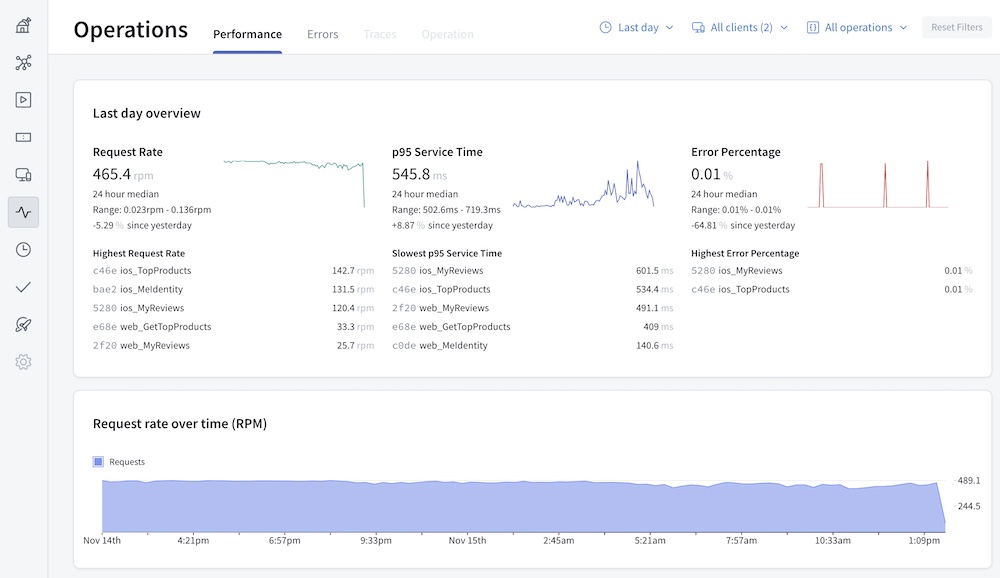
You can visualize operation metrics in Apollo Studio, from any variant's Operations page:

This page gives you a helpful overview of your supergraph's recent performance, including:
- The rate of requests sent to your router
- Your supergraph's p95 service time
- Your supergraph's error rate
The page displays overall values for these metrics, along with values broken down by operation name. You can click an operation name to view more detailed information for it.
Resolver-level traces
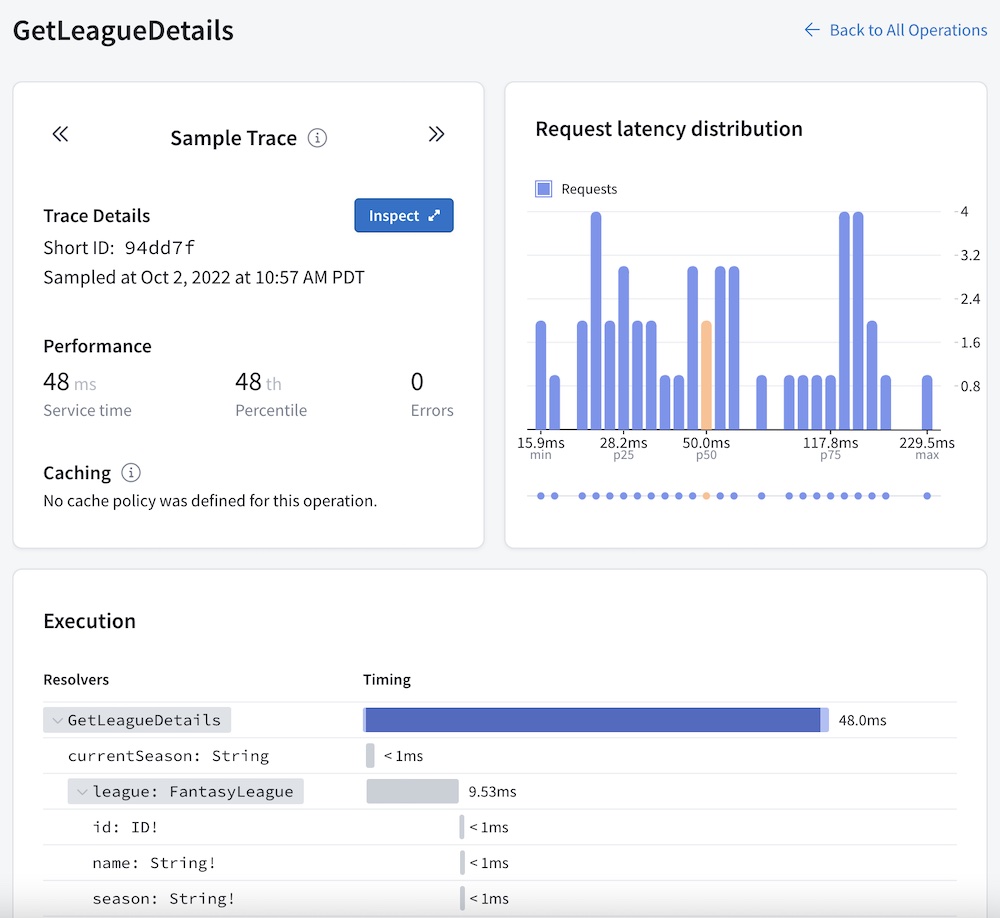
If you enable trace reporting in your subgraphs, Apollo Studio can also display resolver-level trace information about each operation:

Shown above, the Traces tab for an operation provides a breakdown of timing and error information for each field that's resolved as part of that operation. This helps you identify opportunities to improve your supergraph's overall performance by optimizing whichever resolvers currently act as a bottleneck.
Enabling traces
To enable federated trace reporting in your subgraphs, consult the documentation for the GraphQL server library your subgraph uses.
Not all subgraph-compatible libraries support federated trace reporting.
To confirm the support status for your library, check its FEDERATED TRACING entry in Federation-compatible subgraph implementations.
If your subgraphs use Apollo Server with the @apollo/subgraph library, federated trace reporting is enabled by default. You can customize Apollo Server's trace reporting behavior with the inline trace plugin.